anchorWhy console?
JavaScript is getting old, yet the best way to know what's going on, is a simple console.log in the right place. Read on Chrome Dev site everything you need to know about console. Disclaimer, I find no real value of most of them.
Working with complex frameworks that abstract vanilla JavaScript, we need to log everything in console during development, and that is the main "why".
anchorWhat to console?
Here are some examples of things that need to be logged:
- Request and response of an HTTP call
- State update
- Initialization sequence
- Configuration ready
- Special third party logging events.
- Temporary attention messages
We also need a way to distinguish general logs, warnings and errors.
anchorWhere to console?
We want to disable logs upon environment change, particularly production. Thus the console.log should not be called directly, rather wrapped in another function, that distinguishes environment.
anchorThe script
Working backwards, we need a way to do this:
ourFunction(object);
We also want to call a message, but the message is optional:
ourFunction(object, message);
And we want to distinguish the different types of logging:
ourFunction.log(object, message);
ourFunction.info(object, message);
But we do not want to couple it too tightly, so we'll just pass the type as an optional parameter.
ourFunction(object, message, type);
So let's write ourFunction
function ourFunction(o, message, type) {
  // switch type to have different flavors
  console.log(message, o);
}
The first enhancement is obviously the function name. I shall call it _debug. After years of using different names, and clashing with third party, and getting confused with the log, this name withstood the test of times.
Of course, you might argue, why not place it in its own module? You can. I refuse. I want something as dumb as console.log, even dumber.
The second enhancement is adding format to the logs, so they look like this:
console.log("%c " + message, style);
As for types, the basic types we want to log are general info (we can add new styles per request), errors and failures, traces, API call results, and warnings.
Third enhancement is to detect a variable before logging, a variable that is set to false in production. And no, this variable is not fed directly from environment, I'll tell you why later. This global constant could be:
window._indebug
Putting it together:
function _debug(o, message, type) {
  if (window && window._indebug) {
    switch (type) {
      case 'e': // error
        console.log('%c ' + message, 'background: red; color: #fff', o);
        break;
      case 't': // trace error
        console.trace('%c ' + message, 'background: red; color: #fff', o);
        break;
      case 'p': // http response
        console.info('%c ' + message, 'background: #222; color: #bada55', o);
        break;
      case 'w': // warning
        console.warn('%c ' + message, 'background: #4f560f; color: #e6ff07', o);
        break;
      case 'gtm': // gtm events, special
        console.info('%cGTM: ' + message, 'background: #03dbfc; color: #000', o);
        break;
      default:
        console.info('%c ' + message, 'background: #d9d9d9; color: #a82868; font-weight: bold;', o);
    }
  }
}

// set _indebug to true in your environment file, could be anywhere
window._inebug = !process.env.production
Example of environment setting in Angular, is in /environment.ts file directly, and since it is in typescript and may run on SSR, check for window, and access it indirectly.
window && (window['_indebug'] = true);
The last enhancement is to add a seperate function, for "attention", that is needed during development. This looks different, and can easily be found and removed from code. Those are not supposed to exist, they are there to make us ditch the habit of ever "console.logging".
function _attn(o, message) {
  if (window && window._indebug) {
    // use debug to filter in console window
    console.debug('%c ' + message, 'background: orange; font-weight: bold; color: black;', o);
  }
}anchorTypescript
To make it available in typescript, we need to declare it in a typing file, could be typings.d.ts, that is included in the tsconfig. The script is still written in JavaScript, and added to files included in build, because, as you already know by know, it must stay dumb!
// in typing.d.ts
declare function _debug(o: any, message?: string, type?: string): void;
declare function _attn(o: any, message?: string): void;anchorUsing it
The most popular use of custom console logging is intercepting fetch requests. One vanilla way to intercept all fetch calls, is to overwrite fetch. Let's do that:
const oFetch = window.fetch;
window.fetch = async (...args) => {
const response = await oFetch(...args);
// let's console here, something like resource url and response
_debug(response, 'GET ' + args[0], 'p');
if (!response.ok) {
// log errors
_debug(response.statusText, 'Error', 'e');
return Promise.reject(response);
}
return response;
};
// when used in client
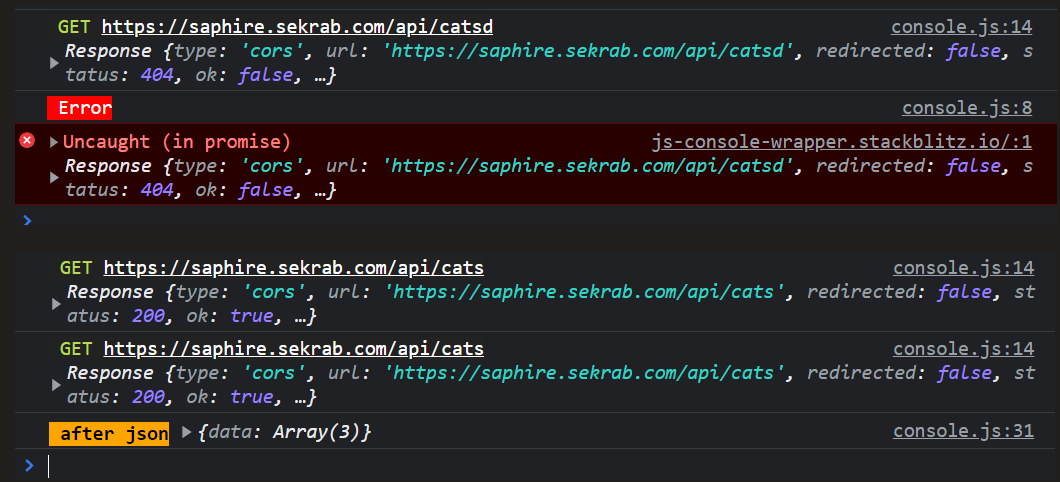
fetch('https://saphire.sekrab.com/api/cats')
.then((response) => response.json())
.then((json) => {
// use _attn for temporary logging
_attn(json, 'after json call');
});Running in StackBlitz, it looks like this
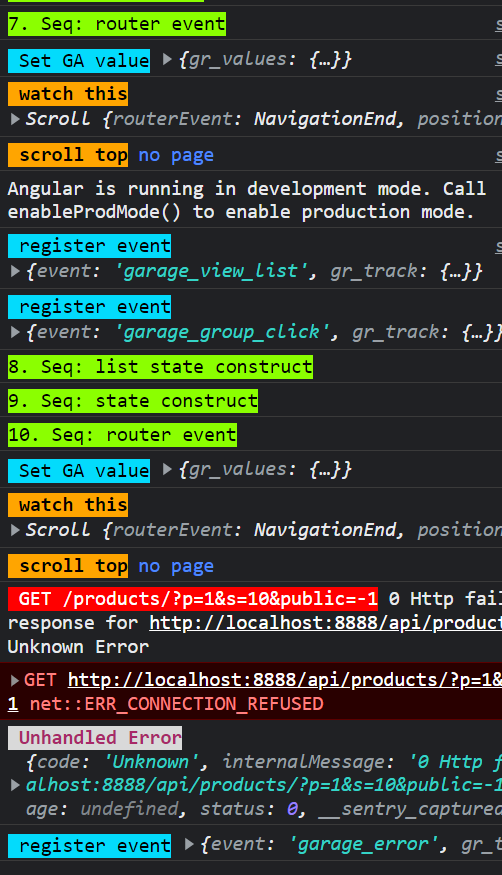
Another example, is a call for GTM register event:
function registerEvent(data){
  // ... call dataLayer push, then log
  _debug(data, 'register event', 'gtm');
}anchorA backdoor
Why did we set a global variable? In an SPA, after first page load, we can set the global variable to true in devTools console, and gain access to these messages on production. It is safe, because it only logs already available information.
For other than SPA, or to make it set to true on load, we can gain access to the backdoor with a URL parameter, again, it's safe, and benign:
const _insearch = window.location.search.indexOf('debug=true') > -1;
if (_insearch) {
    _indebug = true;
}
So now you can share a link with ?debug=true in URL with your team, to gain access to the logged messages, for better insights.
anchorAngular
We can make great use of this function in Angular, logging state changes, HTTP interception, error handling, and more. Come back next week, or may be earlier. 😴
Did I make you look? There is no such thing as BinCurse.