Following up with our console wrapper, in this article I will use that specifically in an Angular app. The logging can be useful in RxJS piping, and error logging.
First, let's add the script to the assets, and declare it in typings.d.ts (as mentioned in the previous post).
{
 "projects": {
   "main": {
     "architect": {
       "build": {
         "options": {
           "scripts": [
             // add the script however you wish
              {
                "input": "src/assets/js/console.js",
                "bundleName": "script"
              }
            ]
         }
       }
     }
   }
 }
}
This, on SSR run, will error on server side, we will fix it later.
The final project is on StackBlitz
anchorAngular error handling
The default error handler in Angular logs out the unhandled error. We can override it with our own ErrorHandler (provided in root app module):
@Injectable()
export class OurErrorHandler implements ErrorHandler {
    handleError(error: any) {
      _debug(error, 'Unhandled Error', 'e');
    }
}anchorUse it with RxJS
We can create a custom operator that outputs the message in a pipe:
export const debug = (message: string, type?: string): MonoTypeOperatorFunction<any>  => {
  return pipe(
    tap(nextValue => {
       _debug(nextValue, message, type);
    })
  );
};

// this is used with observables like this
obs$.pipe(
  debug('obs value')
);
In a previous article about RxJS based state management in Angular, we had a base class for state. We can update it with a debug statement to log all state progress. In StateService:
export class StateService<T>  {
 protected stateList: BehaviorSubject<T[]> = new BehaviorSubject([]);
 stateList$: Observable<T[]> = this.stateList
    .asObservable()
    // pipe to debug the constructor used, like ParamState, or TransactionState
    .pipe(debug(this.constructor.name));
}
Now any updates to state will be logged in console.
anchorHttp interceptor
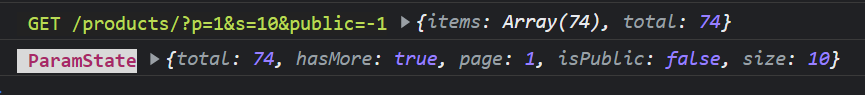
In devTools debug, network failed attempts are logged showing the full URL, but not successful attempts. Let's add the debug operator to the HttpInterceptor to log all data the way we like it, that's the way it has to be 😉
[method] [URL] [response body]
@Injectable()
export class OurInterceptor implements HttpInterceptor {
  intercept(req: HttpRequest<any>, next: HttpHandler): Observable<HttpEvent<any>> {

    // adjust req if needed
    return next
      .handle(req)
      .pipe(
        // pipe with req information, method, and url with params
        debug(`${req.method} ${req.urlWithParams}`, 'p')
      )
    }
}
Let's rewrite the debug operator to handle the following:
- if
nextValueis of typeHttpResponse, we need to log the body - we also need to filter out the useless value of type
Sent. That's a an event set before every http response of little value, and it isundefinedin other observables.
export const debug = (message: string, type?: string): MonoTypeOperatorFunction<any>  => {
     return pipe(
        tap(nextValue => {
            let value = nextValue;

            if (nextValue instanceof HttpResponse) {
                // value is the body
                value = nextValue.body;
            }
            // just filter out the sent event
            if (nextValue && <any>nextValue.type !== HttpEventType.Sent){
                _debug(value, message, type);
            }

        })
    );
};
Now my log looks like this
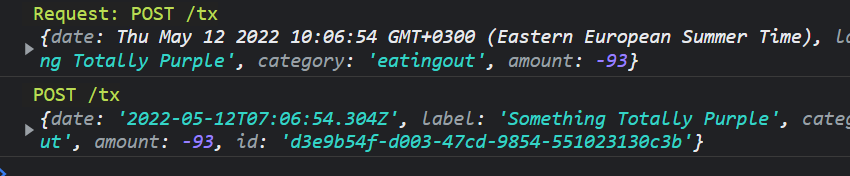
We can also log the request body in case of PUT or POST events, in the Http interceptor:
@Injectable()
export class OurInterceptor implements HttpInterceptor {
  intercept(
    req: HttpRequest<any>,
    next: HttpHandler
  ): Observable<HttpEvent<any>> {

    // log request body, prefix to distinguish or create a new console type
    if (req.body) {
      _debug(req.body, `Request: ${req.method} ${req.urlWithParams}`, 'p');
    }

    return next.handle(adjustedReq).pipe(
     //...
    );
  }
}
The log looks like this
Let's push it up a notch. Let me log Http errors as well, using the tap extended call back, like this:
export const debug = (message: string, type?: string): MonoTypeOperatorFunction<any> => {
  return pipe(
    tap({
      next: (nextValue) => {
        let value = nextValue;

        if (nextValue instanceof HttpResponse) {
          // value is the body
          value = nextValue.body;
        }
        // just filter out the sent event
        if (nextValue && <any>nextValue.type !== HttpEventType.Sent) {
          _debug(value, message, type);
        }
      },
      error: (error) => {
        // in error, log erros, check for pecific type of http response errors
        let value = error;
        if (error instanceof HttpErrorResponse) {
          value = `${error.status} ${error.message}`;
        }
        _debug(value, message, 'e');
      },
    })
  );
};
Before I show you the log, I went back to the GTM Angular service we built last week, and added a _debug statement as well:
// GTM service updated from a previous post
export class GtmTracking {
  // ...
  public static RegisterEvent(track: IGtmTrack, extra?: any): void {
    let data = {
      event: track.event, gr_track: {
        source: track.source,
        ...extra
      }
    };
    // add a special type of log here
    _debug(data, 'register event', 'gtm');
    this.Push(data)
  }

  public static SetValues(values: any): void {
    let data = {
      gr_values: { ...values }
    };
    // and here:
    _debug(data, 'Set GA value', 'gtm');
    this.Push(data);
  }
}
In the ErrorService, we called the GTM register event, so now we end up with a console log looking good:
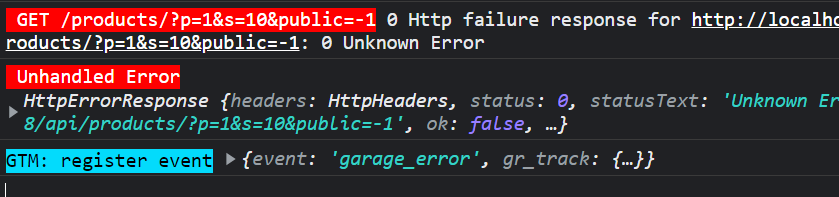
The error object can be enhanced further, but that is a different subject, and a different post.
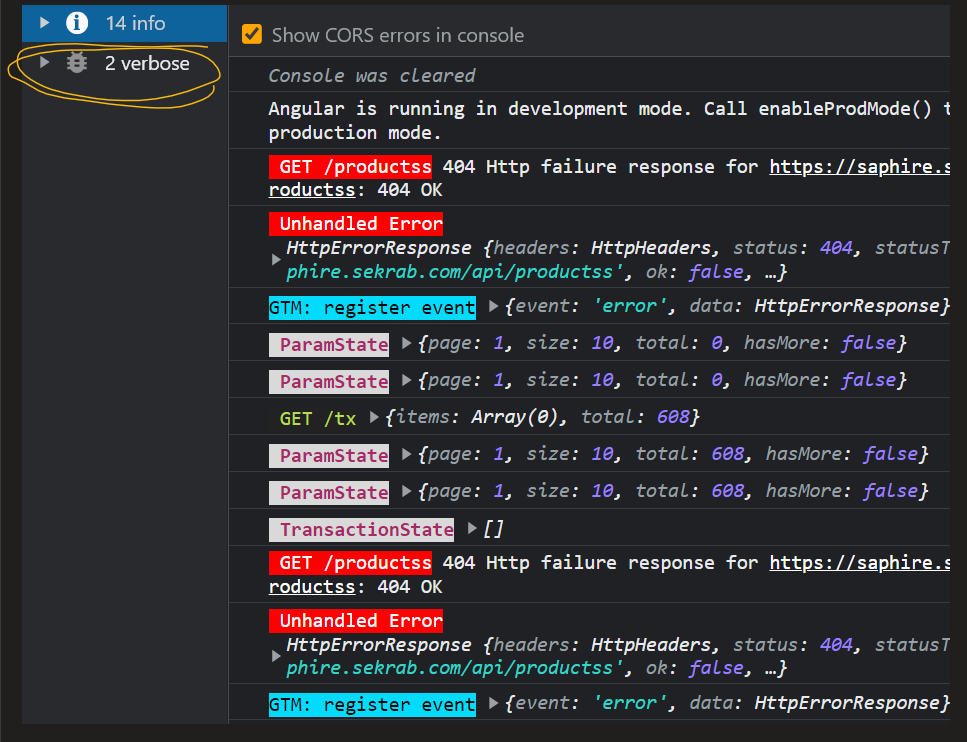
anchorConsole filtered view
There is a reason why I console.log errors instead of console.error, and that is; the bad habit of filtering console into info messages, and forget to switch back to all messages. Attention span ever shrinking. This way we never miss out on errors, and we get to enjoy some sanity on retirement.
_attn was created on purpose to replace the usual console.log, the output of _attn calls is shown under console verbose logs, and they look bright, bright enough to remember to remove them before we build. If however we fail to remove them, that's okay, they won't be displayed in production anyway.
Does that affect performance? Not in 99% percent of apps (99% is like saying half of the world, not a real statistic).
anchorServer platform logs
The script used, is a JavaScript added to build, and injected in index.html. This is done on purpose because I do not wish to import every time I use. There is another perk out of this approach. First, let's fix server platform not running because those methods do not exist in NodeJS. This is done by defining those functions in NodeJS global object. The NodeJS express server should contain the following
// fix NodeJs server running SSR
global._debug = function (o, message, type) {
  if(process.env.NODE_ENV !== 'production') {
    console.log(message, o);
  }
};
global._attn = function (o, message) {
 if(process.env.NODE_ENV !== 'production') {
    console.log(message, o);
  }
}
Now, we can display messages on server, after build, but before deployment. Turn it on or off without rebuilding. Context is king, separation is the new queen.
Thank you for reading this far. Let me know if I played any wrong hands.